

Region overview
This image shows a large region within a chromosome, contig or scaffold. The 'Genes' data track is always displayed by default.
Gene colours are as follows:
- Gold and red genes: protein coding
- Grey, purple and blue: non-coding
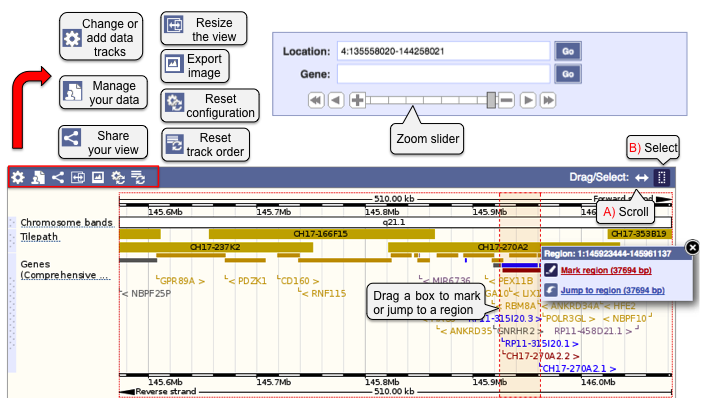
In addition to the 'Genes', extra tracks will be on by default depending on the species e.g. 'Chromosome bands' and 'Tilepath' for human. Data tracks can be added using the Configure this page button at the left, or the cog wheel icon in the top left of the image. Other icons in the Region overview image allow you to add custom tracks, share or resize the view, export the image, reset the configuration and reset data track order.
This Region overview image is zoomable (zoom slider) and is scrollable in up to date versions of Chrome, Firefox, and Internet Explorer 9 and later.
The Drag/Select option in the top right of the image allows you to scroll to a region or select a region. Select Scroll to move along the genome with a click and drag, and let go to allow the page to reload with your new location. Click Select to drag out a box around a region or feature of interest to view a pop-up window. You can then Mark a region in the view or Jump to a region (Figure 2).